Digital Completions in Plant Modifications and Upgrades
Unlike greenfield or any new build construction projects, plant modifications and upgrades present a unique set of challenges. Work is carried out...
It has been more than two decades since oil & gas facilities across the North Sea began their quest to improve safety and profitability. The Cost Reduction Initiative for the New Era or CRINE, focused efforts on developing techniques to reduce personnel numbers on-site to repair and maintain the facility, lowering cost and reducing the overall risk inherent at these remote, offshore sites.
One target for that era was a traditional survey and rudimentary dimensional control processes. These were essential for minor modifications and facility sustaining activities, which originally involved tape measures and string.
The evolution started with lasers and photogrammetry, harnessed to increase accuracy, and reduce work time while improving quality. Today, the journey continues with technologies merging with software solutions, delivering an all-encompassing virtual tool, enabling all to visualize the complexity of projects and facilities as part of a digital twin. This combination unlocks ever more limited resources, funding, and attention from decision-makers.
Edward Johnson is an Energy Sector consultant with more than three decades of experience in the Oil and Gas industry. Edward experienced this transition to digital technology during his contract in Norway in 2005, where locally sourced software solution companies taught him the importance of embracing new ways of working. Norway has some of the most advanced offshore work management systems in the world underpinned with data and technology.
On his return to the US, one of the first questions to colleagues was ‘Do you use laser surveys and dimensional control across the spectrum of brownfield work. Can you deliver it right the first time?’, the response was usually ‘No, we have a highly productive workforce with great experience. We don’t see any reason to change’. Edward goes on to explain:
“Of course, laser survey and dimensional control did exist. It wasn't brand new technology, but its use wasn't widespread because the Oil industry tends to rely on tried-and-true methods proven to work albeit not necessarily for the lowest cost.
Using these tools to bring a remote worksite into the engineering office, deployed as part of the raw material receipt and fabrication, is valuable. Add in together the ability to aid delivery to the worksite for custom fabricated items, while helping to demonstrate completion of the work performed, the package is clearly impactful and possible, but not widely used in the Gulf of Mexico at the time.
When his colleagues heard that there were other ways of doing it, they were intrigued. Methods that reduced the amount of people offshore in harm's way, means of speeding up processes making them more available for a design, survey, review, and discussion while all improving quality, his colleagues soon asked for proof!”.
In more recent years, US-based organizations have adopted these technologies as well as developed new ones. Yet they still face challenges convincing senior managers to embrace digital transformation – they have seen many promises go empty after agreeing on the strategy. Some of this problem, Edward believes, is actually down to software solutions not linked to tangible returns:
“Some of these solutions present an amazing ‘wow’ factor, the sales presentation is incredible leaving you feeling like you’re walking through virtual space with all the images enhanced by a computer. It looks great, right? But the big question is, does it add any value and make a difference to the bottom line? It’s hard to differentiate, and explain that it does, if in the right context with the right collaboration and integration.
What I’ve always pushed to people is that you can bring in any amount of software you want with fantastic graphics and visualization, but if it's not linked to the design effort and pre-fabrication or to the construction and safety evaluations, then it's more a pleasant pastime rather than a game-changer.
Obviously, you read many publications showing digital transformation and the quest for digital twins as the things that people want to be associated with, but it's hard to say exactly how it’s adding value? What am I doing with it? Why is it important? Why should I invest in this? That's why I really stress the visualization of the data in a relatable space which easily demonstrates a real improvement over the past”.
But what does this visualization mean in practical terms? Edward illustrates his point:
“Here in the US, many companies have vast amounts of data in inspection logs, spreadsheets, and databases, however, it requires an inspector, a technician, or other specialists to look at the data and be able to act upon it. If the data crosses many disciplines, no one person can assess and chart the safest and most optimum path in reaching a decision.
Importantly, the person who approves budgets and resources cannot easily get behind those on the front lines because it's an overwhelming amount of data, lacking any connection with what they can see with their eyes, fully understand, and then fight for budgets from senior executives.
Visualizing in a three-dimensional space is extremely important because you can, as a practitioner, look at the density of work, the relative elevations, locations of staging areas, escape routes and other unrelated and sometimes high-risk activities happening nearby.
The virtual model enables all disciplines to think about sequencing their work and leveraging shared tools including scaffolding, local lifting apparatus, shared materials management, etc. Resources can be optimized, access to operations’ staff is made more efficient and emergency planning is easier to communicate to employees and those who live and work in the surrounding areas.
If you're an emergency response leader, you want to make sure that the ability to access this area, or escape in an emergency, needs to be well understood and communicated. And now that you can see it in a 3D space, you can do that.
From a management perspective, you can go to your partners, senior executives, or regulatory bodies, and show that this is critical work which has been thoroughly studied, reviewed with all stakeholders and resources optimized, without compromising the community.
You can show it in a three-dimensional way where anyone can readily understand. And that just makes it a lot easier to release funds and resources and commitment to get the job done”.
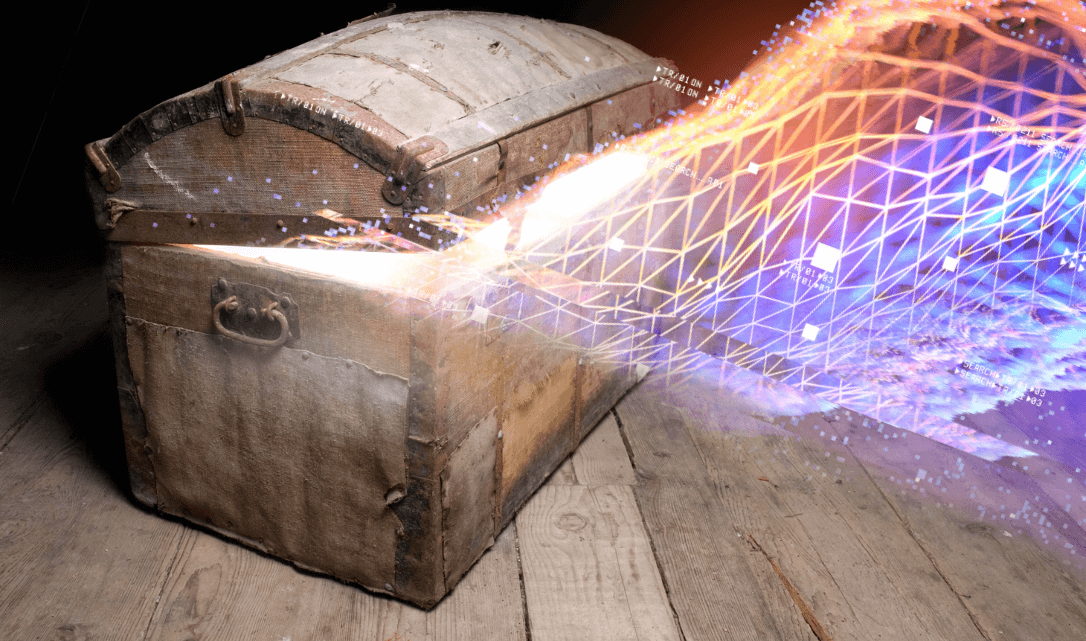
Edward reiterates that it is not enough to have the latest, most advanced hardware and software, the context of how it improves decisions on engineering, design, procurement, and execution is most important. If these factors are not packaged together, then the ability to see it visually has an interesting effect for a few moments, but then it is lost. This is due to no connection to the other processes, or the backbone of the real work actually being achieved. Ever-increasing sources of data remain locked in a ‘treasure chest’ until a solution comes along which can place these ‘valuables’ in a visual space.
Buy-in from the end-users, the operations and maintenance teams, is a critical factor in the decision-making process. Some may need convincing that software solutions, enabling visualization of a project and facility, are worth the expense to avoid unintended interruptions to daily operations and maintenance.
Most worksites in the Energy Sector have limited space, limited access to tools and expertise, therefore creating natural pinch points with suppliers and contractors, operations, wells, and projects. Even just access to decision-makers in Operations, Maintenance and Wells can be difficult to obtain.
Detailed planning and scheduling are an elusive idea with so many teams working in a place full of constraints, with little ability to visualize how it all comes together. Finally, being issued a permit normally involves risk assessments, work scope ‘walkdowns’, and must be compared with other permits to ensure safety. Including visual representations, overlayed with the right amount of data and work plans, help reduce risks and gain rapid buy-in from those most affected, reducing the time required to obtain permits to work. Faster project cycle times further save investment costs and shortens periods of impact to ongoing operations. Ed explains:
“Initially they're a little bit skeptical because they see lots of examples of people who bring different technologies full of promise. Proponents of these offerings often can't connect these to real-world problems, and how it affects operations, how is it going to lower costs, reduce risk, improve efficiency, shorten the downtime. Those are the keys to linking the technology to real value levers. Barriers go up when operations can’t see it; can’t understand it.
The thing is, in the Energy sector a successful effort, whether it be a new development, a modification, a debottleneck, or decommissioning project, all rely upon integrated teams of multiple disciplines. There are many projects in our industry where success depends upon a specialist in subsurface interpretation, another from the subsea equipment group, someone from wells to guide completions, topsides engineers and export business leaders who all have important roles in delivery. How is it possible to unify around a concept because all concepts have pluses and minuses which must be balanced? If there is no way to offer a unifying solution and a way to explain it; the opportunity is lost”.
Many companies now celebrate an entrepreneurial spirit in growing revenue, cutting costs, and pushing technology. An engineer in the team says, ‘I think we could make more money from this facility by extending its life if we made these modifications but how do I convince managers to invest in this aging facility? How do I convince everyone to join me in that dream?’ A visual representation of what is possible turns highly technical, cross-discipline data, into a coherent frame.
When augmented with the data that shows how production will be improved, or uptime increased, or the number or duration of shutdowns are reduced, then people can all gather around that conversation and agree to it.
With only spreadsheets and raw data, only a small fraction of the team can really see the trends evolving. Whereas if the goal is to have the largest contingent of people agree and support you, visualization is the key.
The challenge has historically been that most operators are familiar with dimensional control, laser scanning and photogrammetry. They see these tools as minor players in a construction project. Edward believes there is more opportunity to hand:
“Pictures have been taken and a survey has been sent, therefore pieces will fit – that’s what typically happens now. But the challenge and the opportunity lie with bringing visualization much earlier into the thought process. This can help optimize facilities design, enable packaged equipment through higher tolerances, shorten work time and shutdowns, using innovative techniques supported by capture and visualization of existing and proposed design data.
The challenge is not telling people, ‘We offer 3D visualization’, as that is not so new to them. If there was a possibility to bring it earlier in the process and more broadly deployed, this would positively influence design decision-making, and link that with static and live data, as you would in a digital twin. Companies are then more likely to be interested and say, ‘tell me more’.
I'm an advocate of bringing different parties together who don't all have the same frame of reference. Everyone brings experience and expertise but not everyone can easily describe that to others not immersed in that specialty. When using two-dimensional data, you have the realities of how you modify, do construction, or otherwise impact an operating facility. It’s very challenging to convey risks, opportunities, or inefficiencies based on raw data.
To have a three-dimensional view reduces misunderstandings and creates a canvas for others to contribute; everyone has the same visual perception of what's happening. I think that's partly why digital twins are so popular now because you can represent the facility in real-time as it is today, not what it was imagined years ago. This gives much better support for ideas and fewer hours spent looking for information. I think any company that can take vast amounts of data and make it accessible to virtually anyone in the organization through 3D visualization, then they've really achieved something. You have buy-in; visual cues make all the difference”.
Unlike greenfield or any new build construction projects, plant modifications and upgrades present a unique set of challenges. Work is carried out...
Turnarounds and shutdowns are among the most critical—and stressful—phases in the management and operation of industrial assets. These planned...
Offshore decommissioning and asset retirement present significant logistical, regulatory, safety, fiscal and reputational challenges. The process of...
As the world is rapidly advancing into the 4th industrial age, Oil & Gas continue to remain essential to the energy sector and a key enabler for the...
The Global Pandemic has brought with it, death, devastating life changes and a myriad of workplace changes. The Energy industry did not escape the...

If the COVID-19 pandemic has taught us anything, it’s that businesses must be able to function remotely. Industrial sectors may be more reticent to...